

Reversing plaque: how far cholesterol has to fall, and why the calcium score rises
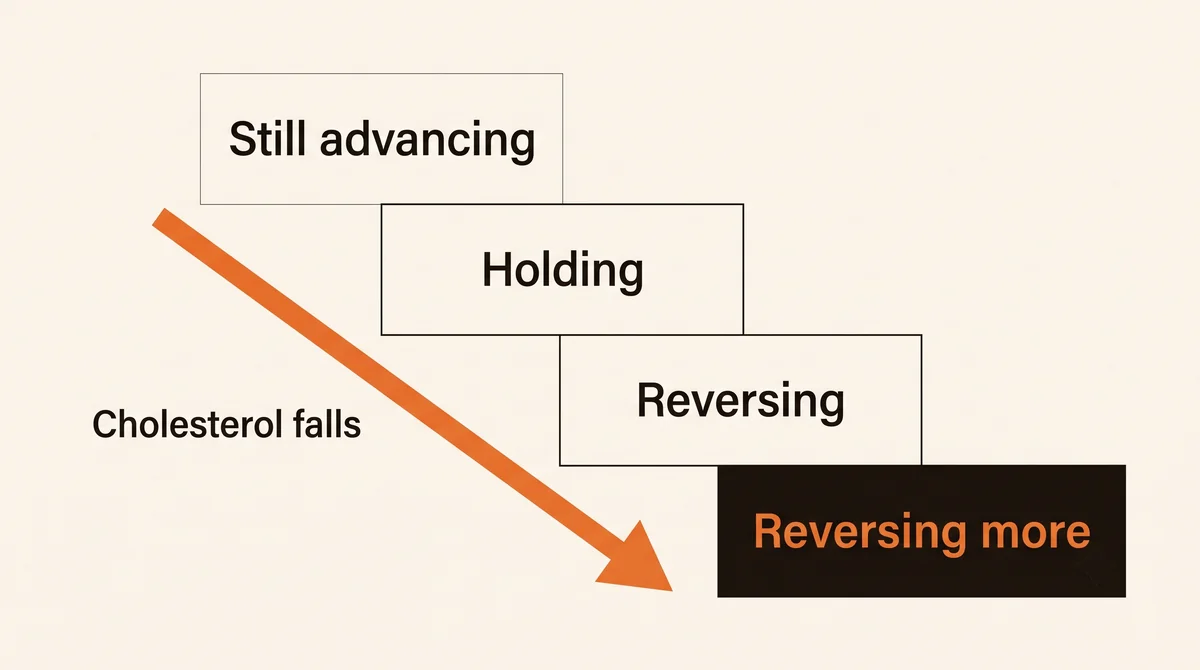
How far cholesterol falls decides which of two different things happens. Around 100 mg/dL the disease is roughly holding. Reversal doesn't appear until the 60s and 70s, and it goes on increasing below that.
Coronary plaque can be reduced
It can, and it has been watched happening.
The evidence doesn't come from calcium scores or stress tests. It comes from intravascular ultrasound, which means threading a catheter with an ultrasound transducer on its tip into a coronary artery and pulling it back through a defined segment while it images the vessel wall from the inside. Unlike an angiogram, which shows only the channel the blood flows through, this measures the wall itself: how much plaque is there, and after a year or two of treatment, how much is there now. The same segment is found again at the second look using side branches as landmarks, and the images are read by people who don't know which treatment the patient received.
Two measurements come out of it. Total atheroma volume is the amount of plaque in the segment, in cubic millimetres. Percent atheroma volume is the share of the vessel cross-section occupied by plaque, which is the more demanding measure because a plaque can grow while the artery enlarges around it and the percentage stays flat.
The scale these numbers live on
Percent atheroma volume is itself a percentage, so a change in it's quoted in percentage points, and the size of the change only means something against the starting value.
In the patients enrolled in these trials, people with coronary disease, undergoing an angiogram, plaque occupies roughly 36% to 40% of the vessel cross-section at baseline. That was 39.9% in the rosuvastatin study, 38.2% and 40.0% in the two arms of the atorvastatin-versus-pravastatin trial, 36.2% in the rosuvastatin-versus-atorvastatin comparison, and about 36% to 37% in the PCSK9 trial.
That range isn't arbitrary. A coronary artery accommodates growing plaque by enlarging outward, so the channel stays open while the wall thickens, and this continues until plaque occupies about 40% of the area inside the vessel's elastic membrane. Past that point the artery stops compensating and the plaque begins to narrow the channel. So the typical patient in these trials is sitting at the shoulder of that curve, which is why small movements in either direction are taken seriously.
The trials that measured plaque directly
The clearest single demonstration, the ASTEROID trial, used rosuvastatin 40 mg in 507 patients, of whom 349 had usable images at both time points 24 months apart. LDL cholesterol fell from an average of 130 mg/dL to 61 mg/dL, a reduction of 53%.
Percent atheroma volume went from a median of 39.9% to 38.5%, a fall of 0.79 percentage points (97.5% confidence interval 0.53 to 1.21), which is about a 2% relative reduction in the plaque burden.
The volume measures changed more. Across the whole imaged artery, plaque volume fell from a median of 204.7 mm³ to 186.8 mm³, a reduction of 12.5 mm³ or 6.8% of the starting volume (95% confidence interval 5.60% to 7.82%).
The trial also reported a larger-looking result, a 9.1% fall in the worst-affected 10 mm of artery, and that one deserves less weight than its size suggests. The rule for picking that segment was to find the 10 mm with the most plaque at baseline, then measure the same stretch again later. Choosing the highest of many measurements selects partly for disease that's truly there and partly for the moment the measurement happened to read high. on a second look the second part doesn't repeat, and the value falls whether or not anything was treated. Every patient in this trial received the drug, so there's no untreated group in which the same drift would show up and cancel out.
That caution applies to that one endpoint and not to the others. The whole-artery measures weren't picked for being extreme, so the same drift doesn't apply to them, and they're the values to read.
A trial with a comparison group, REVERSAL, randomised 654 patients to atorvastatin 80 mg or pravastatin 40 mg for 18 months. LDL fell to 79 mg/dL on the intensive regimen and 110 mg/dL on the moderate one. On the moderate regimen, median percent atheroma volume rose from 40.0% to 41.8%. On the intensive one it went from 38.2% to 38.7%. Neither arm regressed. one arm progressed and the other close to held.
The largest comparison, SATURN, put rosuvastatin 40 mg against atorvastatin 80 mg in 1,039 patients over 104 weeks, starting from a median percent atheroma volume of 36.2% in both arms. LDL reached 63 mg/dL and 70 mg/dL respectively. Percent atheroma volume fell by 1.22 percentage points on rosuvastatin (95% confidence interval 0.90 to 1.52) and by 0.99 on atorvastatin (0.63 to 1.19), a separation of about 0.2 percentage points between two maximal doses, with intervals overlapping along most of their length. Total plaque volume, from a baseline of about 144 mm³, fell 6.39 mm³ on rosuvastatin against 4.42 mm³ on atorvastatin, or roughly 4.4% and 3.1% of the starting volume. The finding that matters more for a patient than which drug won: plaque regressed in the majority of people in both arms, 68.5% and 63.2% by percent atheroma volume, 71.3% and 64.7% by total volume.
Adding a PCSK9 inhibitor to a statin was tested in GLAGOV, 968 patients over 78 weeks, from a baseline percent atheroma volume of about 36% to 37%. This trial is the most informative of the four, because both arms were already on a statin, so it isolates what further lowering buys. LDL was 93 mg/dL on statin alone and 37 mg/dL with evolocumab added. On the statin alone, percent atheroma volume changed by +0.05 percentage points (95% confidence interval −0.32 to +0.42), an interval centred on zero and narrow enough to say the plaque was holding steady, not that the trial was too small to tell. With the addition it fell by 0.95 points (0.58 to 1.33). The between-group difference was 1.0 point (0.64 to 1.8). The proportion of patients whose plaque regressed rose from 47.3% to 64.3%, a difference of 17.0 percentage points (10.4 to 23.6).
The second finding: how far the level falls decides what happens
Read the four trials in order of the LDL cholesterol they achieved, not in the order they were run, and a second result appears that's at least as useful as the first.
| Achieved LDL cholesterol | What the plaque did |
|---|---|
| 110 mg/dL, pravastatin 40 mg | progressed: percent atheroma volume rose from 40.0% to 41.8% |
| 93 mg/dL, statin alone | held: +0.05 percentage points (−0.32 to +0.42) |
| 79 mg/dL, atorvastatin 80 mg | close to held: 38.2% to 38.7% |
| 61 mg/dL, rosuvastatin 40 mg | regressed: −0.79 points, 6.8% of plaque volume |
| 63 and 70 mg/dL, two maximal statins | regressed in about two-thirds of patients |
| 37 mg/dL, statin plus a PCSK9 inhibitor | regressed most: −0.95 points, 64.3% of patients |
The ladder is the answer to a question patients ask constantly, which is why a target of 100 mg/dL, or even 70, doesn't feel like enough. At around 100 the disease is roughly holding. Reversal doesn't appear until the 60s and 70s, and it keeps increasing below that. A goal that stops progression is a different goal from one that reverses it, and the guidelines have historically aimed at the first.
The clearest demonstration is inside the PCSK9 trial. Among the 144 patients whose LDL was already below 70 mg/dL before the trial started, adding the drug still changed plaque by −1.97% against −0.35% on statin alone, and the proportion whose plaque regressed went from 48.0% to 81.2%. Being at 70 wasn't the floor for these patients. Going lower still bought more.
So there are two findings here, not one. Lowering cholesterol stabilises plaque, and lowering it a great deal reverses plaque, and the second isn't a stronger version of the first so much as a different achievement.
The size of a one-point change
Set against a starting point near 40%, a fall of one percentage point is a small movement, on the order of 2% to 3% of the plaque that's there. Being concrete about that matters, because otherwise the word "regression" do work the measurement can't support. Nobody's artery was cleaned out. What these trials show is a reversal of direction: untreated, it goes up. treated hard enough, it goes down slightly.
The measure to hold onto is the volume one, because it answers the question a patient is actually asking. Comparing one drug against another tells you which to prescribe. Comparing an artery against its own earlier image tells you whether the disease moved, and that's the question. In the rosuvastatin study it moved by 6.8% of the plaque that was there, in twenty-four months.
Which raises the question everyone wants answered next and no trial answers: what would that do over thirty years? If 6.8% every two years simply continued, almost nothing would be left after two decades, and that arithmetic is the reason these trials matter at all.
It won't continue at that rate, and the reason matters. What comes out of a plaque is the soft, lipid-rich part. That compartment is finite, and once it has gone the rest is fibrous tissue and calcium, which doesn't leave. So the curve almost certainly flattens: fast while there's removable material, slow once there isn't. Nobody has imaged the same arteries for thirty years to say where it flattens or how much of a given plaque is removable in the first place.
What the number does establish is that the direction is achievable and the rate isn't trivial, in a population already carrying established disease. Someone treated earlier, with less accumulated and more of it still soft, is starting from a more favourable position than anyone in these trials.
The direction is what carries the meaning, and it's the second thing to be careful about. No trial has shown that shrinking coronary plaque by a measured amount prevents heart attacks. Coronary plaque volume is a surrogate. It's a well-chosen one, because plaque burden and the rate of plaque progression both track with events, and because the treatments that shrink it are the same treatments that reduce events in outcome trials of tens of thousands of people. But the direct experiment linking the coronary shrinkage itself to the outcome hasn't been run. Coronary plaque volume is a marker of whether a treatment is doing its proximate job, not proof that the shrinkage is what does the good.
That gap cannot be closed, and the reason is exact. To show that shrinking plaque is what prevents the heart attack, you would need an intervention that removes plaque and changes nothing else. No such intervention exists. Every treatment that shrinks plaque also lowers the particles driving it, quiets the inflammation around it, and alters the vessel wall, all at once. So the shrinkage always arrives bundled with the other effects, and no trial design separates them. This is not an experiment that has yet to be run. It is one that cannot be. What can be shown is the next best thing, and it has been shown in a different artery. Carotid intima-media thickness is the wall thickness of the neck artery, measured by ultrasound, and it's easy to repeat. Across 119 randomised trials and 100,667 patients, the degree to which a treatment slowed carotid thickening predicted the degree to which it reduced heart attacks and strokes: each 10 micrometres per year of slowed progression corresponded to a relative risk of 0.84 (95% credible interval 0.75 to 0.93), with the benefit scaling as the slowing increased, 0.76 at 20 micrometres per year, 0.69 at 30, 0.63 at 40. That relationship held whichever treatment was used, in primary and secondary prevention alike.
Read that for what it is, because the size of it is seductive. A hundred and nineteen trials and a hundred thousand people is a great deal of evidence, and it makes the finding feel like it settles more than it does. What all that weight buys is a tighter estimate of an association. It doesn't put the finding on a different footing, and no amount of further trials would, because scale and precision aren't the axis the causal question sits on. It's a relationship between trials: treatments that slowed the wall more also prevented more events. It doesn't show that the slowed thickening is what prevented them, because both are downstream of the same treatment, and a marker of how hard a treatment worked looks identical to a mechanism through which it worked. It's also a relationship between trials, not a promise to any individual, so it doesn't license telling one person that their thinner artery wall has lowered their personal risk by a stated amount.
What it does establish still counts. Unlike the calcium score, this measurement shifts in the direction the treatment is working, and across a hundred trials the size of that shift tracked the size of the benefit. That's the strongest thing a surrogate can earn without a causal experiment, and since the causal experiment is unavailable, it's the standard the coronary measures should be judged against too.
There's also a limit that the four trials above conceal, because all of them enrolled people with established coronary disease who were undergoing angiography. In the PARADIGM study of 1,255 people without known coronary disease, scanned twice by CT at least two years apart, plaque volume increased in both groups. Statin users progressed more slowly than statin-naive patients, 1.76% per year against 2.04% per year, but they progressed. The composition changed substantially, in a way the next section returns to. The volume didn't reverse.
So regression is achievable, and it isn't the ordinary result of starting a statin. It appears at the LDL levels the intensive trials reached, in people whose disease was already established, and even then in roughly two-thirds of them, not all.
Two findings, not one
Two things, and they aren't the same thing.
Cholesterol lowering stops plaque advancing. That happens at the levels ordinary treatment reaches, somewhere around 90 to 100 mg/dL, and it's what most treatment targets were built to deliver.
Lowering it much further reverses plaque. That didn't appear in these trials until LDL cholesterol was in the 60s and 70s, and it went on increasing below that, to the point where four out of five patients starting under 70 regressed when they were taken lower still.
So the value to look at on a lipid panel is the achieved LDL, and the question to ask about it's which of those two things you're buying. A value near 100 is buying the first. The trials that produced the second were operating between 37 and 70.
How far cholesterol has to fall
The question usually arrives in the form of a threshold. Cholesterol moves into the artery wall and it also moves out, the outward path is called reverse cholesterol transport, and the intuition is that somewhere below a particular LDL level the outward flow starts to exceed the inward one and plaque begins to clear. If that number existed, it would be the most useful number in preventive cardiology.
It doesn't appear to exist, and what's there instead is more useful than a threshold would be.
The shape of the relationship
The PCSK9 trial plotted achieved LDL against change in plaque across its whole range. The relationship was a straight line from 110 mg/dL down to 20 mg/dL, no bend, no plateau, no point at which the benefit switched on or ran out. Lower was better at 100, and lower was better at 30, by about the same amount per unit.
The large statin meta-analysis, the Cholesterol Treatment Trialists' Collaboration61350-5), found the same shape against events, not plaque. Across 26 trials and 170,000 people, each 1 mmol/L (39 mg/dL) reduction in LDL produced a rate ratio for major vascular events of 0.78 (95% confidence interval 0.76 to 0.80), and that proportional benefit held in patients who were already below 2 mmol/L (77 mg/dL) on the comparison regimen. All-cause mortality fell by a rate ratio of 0.90 (0.87 to 0.93) per 1 mmol/L.
So the answer to "how low" isn't a number. It's a direction with a constant exchange rate: each further unit of LDL removed buys about the same proportional reduction in risk, wherever you start from. That's a more practical thing to know than a cut-point, because it means a partial reduction counts. Someone who gets from 130 to 100 has bought something, and hasn't failed to reach a threshold.
The outward-transport framing doesn't lead anywhere useful yet
The intuition behind the threshold question is sound: plaque lipid content reflects a balance, and the outward side of that balance has been quantified, in research laboratories. The measurement is called cholesterol efflux capacity, and it's done by taking a person's blood, stripping out the apolipoprotein-B particles, and putting what remains onto cholesterol-loaded cells in a dish to see how much cholesterol the HDL will accept. It carries information a standard panel doesn't. In a population study of 2,924 adults followed a median of 9.4 years, HDL cholesterol itself showed no association with cardiovascular events (hazard ratio 1.08, 95% confidence interval 0.59 to 1.99), while efflux capacity in the highest quartile carried a hazard ratio of 0.33 (0.19 to 0.55) against the lowest. That was replicated in a second cohort of about 3,500 people, where each standard deviation of efflux capacity carried an odds ratio of 0.80 (0.70 to 0.90).
Three things stand between that and a value a patient can act on.
The first is that the assay used in those studies isn't the test that's sold. The cell-culture method is slow and complex, so a laboratory panel was built to stand in for it. Quest, through Cleveland HeartLab, offers the HDL Function Panel with HDLfx pCAD Score, listed in their directory as a reverse cholesterol transport panel. It measures five proteins carried on apolipoprotein A-I–associated lipoprotein particles, ApoA-1, ApoC-1, ApoC-2, ApoC-3 and ApoC-4, by mass spectrometry, and combines them into a predicted cholesterol efflux capacity, reported as pCEC in percent efflux over four hours, against a reference range of 9.1% to 15.6%. In its development study that prediction tracked the cell-based measurement closely, with a rank correlation of 0.86.
The same five proteins are re-weighted into a second score, the pCAD score, reported against a threshold of 71, above which the risk of having coronary atherosclerosis is called higher. That threshold comes from separating 149 patients with a coronary lesion of 50% or more from 69 healthy controls, with a sensitivity of 76% and a specificity of 75%.
Three things about that matter before ordering it. It's a laboratory-developed test: validated under CLIA regulations for clinical use, and not cleared or approved by the FDA. The pCAD score was re-weighted within the same case-control group it's reported to classify better, which is a weaker form of evidence than testing it on a separate group. And the people who developed it wrote, in the paper describing it, that further studies were needed to establish clinical validity, their assessment of their own test, and no larger independent validation has replaced it.
The second is that statins don't move it. In a randomised comparison, twelve weeks of an insulin sensitiser raised efflux capacity by 11.3% (1.8% to 20.8%) against placebo, while sixteen weeks of pravastatin 40 mg, atorvastatin 10 mg or atorvastatin 80 mg produced changes of −0.4%, +2.7% and −2.5%, all with intervals spanning zero. The laboratory selling the panel says the same thing in its own practitioner literature: statins minimally affect or decrease cholesterol efflux capacity, while fibrates and omega-3 fatty acids may raise it. So ordering this panel to check whether a statin increase is working is asking a marker to track an exposure that doesn't move it, and the seller's own materials say so.
One qualification, because it's an open question, not a settled one. What is documented is the effect of statins on efflux capacity as a whole. What a statin does to the five individual proteins the panel measures hasn't been reported, not in the paper that developed the panel, which contains no treatment data at all, and not in the laboratory's own materials. A drug could shift those proteins in offsetting directions and leave the combined score unchanged, and nobody has looked. Anyone tracking this panel through a change in statin dose is running an experiment that hasn't been done.
The third is that the pathway has been drugged, repeatedly, and raising the outward flow hasn't translated into fewer events. Infusing the main protein of HDL after a heart attack produced a hazard ratio of 0.93 (0.81 to 1.05) at 90 days. An entire drug class built to raise HDL and enhance cholesterol removal was tested across four molecules and tens of thousands of patients. the one agent in it that reduced events did so through lowering apolipoprotein B particles, not through raising HDL, and current development in that class has been redirected toward particle lowering for exactly that reason. That story needs its own piece. the part that belongs here is the pattern. The outward pathway is measurable in principle and informative in research. Pushing on it, on the theory that raising HDL will clear plaque, is what keeps failing.
Which leaves the inward side as the part that can be measured, moved, and checked, and that's where the rest of this comes down.
Five-year trials, forty-year decisions
Every figure above comes from a trial lasting about five years. A person in their forties or fifties asking what to do about their arteries is asking about the next four decades, and no trial has ever run that long.
The closest available answer comes from genetics. Some people inherit variants that give them modestly lower LDL from birth, which is a natural experiment in lifelong exposure. Across nine such variants in six genes and 312,321 participants, each 1 mmol/L of genetically lower LDL was associated with a 54.5% lower risk of coronary heart disease (95% confidence interval 48.8% to 59.5%).
Set that against the trials: the same 1 mmol/L, delivered as a drug for about five years, produced roughly a 22% reduction. Same exposure, same units, about three times the effect when it lasts a lifetime.
These are different kinds of evidence and should not be blurred. The genetic result isn't a trial of starting a statin at 25, and it describes a slightly lower level sustained across a whole life, not a large reduction started midway. But the direction of the discrepancy is consistent and it's what would be expected of a disease that accumulates: the quantity that matters isn't the LDL level on a given day, it's the level multiplied by the years spent at it. Trials measure five of those years. The reader is deciding about forty.
The practical consequence is that a five-year trial result understates what the same treatment does over a lifetime, and that a modest reduction held for decades isn't a lesser version of a large reduction held briefly.
The limits, stated
Lower is better across the measured range, and three things are still unresolved.
Nobody has tested LDL levels far below 20 mg/dL, so "no floor found" means no floor was found where anyone has looked, which isn't the same as no floor existing.
Even at 37 mg/dL, only about two-thirds of patients in the PCSK9 trial showed any plaque regression at all. Something other than LDL is driving progression in the remaining third, and it hasn't been identified.
And the safety evidence has the same horizon problem as the benefit evidence. Across 26 trials there was no excess of cancer (rate ratio 1.00, 0.96 to 1.04) or of non-vascular death (0.97, 0.92 to 1.03), including at low achieved LDL. That's a five-year safety record, and it should be described as one, not as reassurance about forty.
The level, and the years spent at it
There's no level below which something switches on, so the useful question isn't "have I reached the target" but "what's my level, and how many years will I spend at it." Both parts are actionable: the level has treatments attached to it, and the years are the part that compounds.
A partial reduction counts. A reduction started earlier does more than the same reduction started later, by a margin the trials can't show and the genetics can.
The calcium score goes up on treatment
Someone who has read this far and started a statin often does the sensible thing: gets a coronary calcium scan, waits three or four years, gets another one to see whether it worked. The score has gone up. Frequently by a lot.
This is the most common way the plaque story goes wrong for a patient, and the explanation isn't that the treatment failed.
Plaque volume and plaque calcium move in opposite directions
The two things were measured in the same arteries, in the same patients, in the same images. A pooled analysis of eight randomised ultrasound trials, 3,495 patients, matched artery segments at both time points, separated people by treatment intensity and tracked plaque burden and calcium separately.
Percent atheroma volume fell by 0.6 percentage points on high-intensity statin therapy, and rose by 0.8 and 1.0 points on low-intensity therapy and no statin respectively. So plaque regressed on intensive treatment and progressed without it, as expected.
Calcium went the other way, and in everyone. The calcium index rose by 0.044 on high-intensity therapy, 0.038 on low-intensity, and 0.020 on no statin, increasing in all three groups, and increasing most in the group whose plaque was shrinking.
One further finding from that analysis matters more than it first appears: the change in calcium correlated with nothing. Not LDL, not HDL, not C-reactive protein. Plaque regression tracks how far LDL falls. calcification doesn't track it at all. These are two separate effects of the same drug, which is the reason a single value that blends them can't be read as one thing.
The score is built to count density as danger
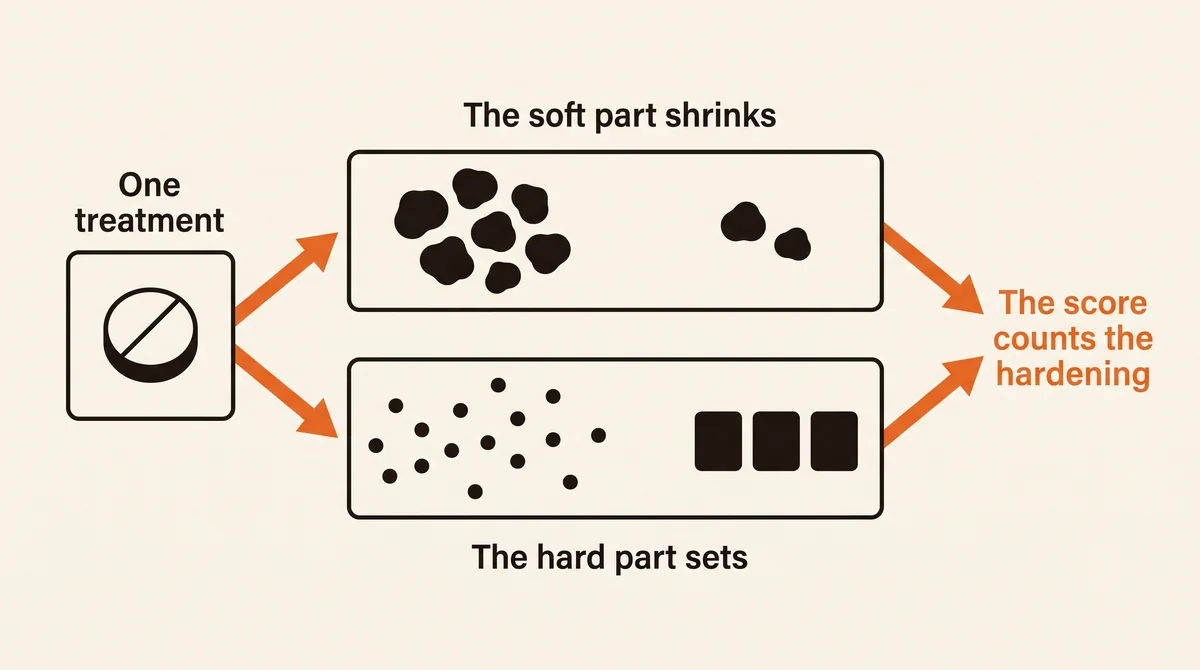
A coronary calcium score isn't a measurement of how much calcium is present. It's the area of each calcified deposit multiplied by a weighting factor of 1 to 4, assigned according to how dense that deposit is. Denser calcium scores higher for the same amount of calcium.
That weighting encodes an assumption, and the assumption runs backwards. In a study of 3,398 people followed a median of 7.6 years, with calcium volume and calcium density entered into the same model, volume predicted events in the expected direction, hazard ratio 1.81 per standard deviation (95% confidence interval 1.47 to 2.23) for coronary events, an absolute increase of 6.1 events per 1,000 person-years. But density ran the other way: hazard ratio 0.73 (0.58 to 0.91), an absolute decrease of 2.0 events per 1,000 person-years. At any given amount of calcium, denser was associated with fewer events. The score multiplies by density as though the opposite were true.
The consequence shows up when the same trials are scored both ways. Across randomised trials of statins, the pooled effect on calcium measured as an Agatston score was −0.06 in standardised units (95% confidence interval −0.19 to 0.06), while the pooled effect measured as volume was +0.26 (−0.11 to 0.63), a difference between the two scoring methods that was itself distinguishable from chance. Same scans, two formulas, opposite signs.
Soft plaque hardening into dense calcium
Three imaging studies describe the same process from different angles.
On CT angiography in 857 patients with 2,458 matched lesions, statin treatment was associated with reduced volume of low-attenuation plaque and fibro-fatty plaque, and increased volume of the densest calcium grades. The cleanest part of that analysis: in lesions that had no low-attenuation or fibro-fatty plaque to begin with, statin therapy produced no change in total calcified volume and still produced a shift toward denser calcium. Nothing was added. What was already there hardened.
In 1,255 people without known coronary disease scanned twice at least two years apart, statin users showed faster progression of calcified plaque than statin-naive patients, 1.27% per year against 0.98%, while non-calcified plaque, the compartment associated with events, progressed at less than half the rate, 0.49% per year against 1.06%. New high-risk plaque features appeared at 0.9% per year against 1.6%.
And on repeat calcium scans in 316 asymptomatic people over a mean of 3.8 years, statin therapy was associated with a decrease in the volume of calcium in the lowest density band in patients who had only that kind, and increases across every density band in patients who had a mixture. Mean calcium density rose by 5.93 Hounsfield units more in statin-treated patients (95% confidence interval 4.33 to 7.54) and peak density by 19.22 units (12.04 to 26.40). Without a statin, the density distribution didn't shift at all.
The limit of the reassuring version
At this point the tempting conclusion is that a rising score on treatment is fine, because the rise reflects calcium becoming denser and denser calcium is safer. The evidence doesn't support saying that.
Pooling five studies covering 21,346 people and 1,309 events, higher calcium density was associated with lower risk overall, hazard ratio 0.80 per standard deviation (95% confidence interval 0.72 to 0.89), after adjusting for risk factors and for calcium volume. Split by treatment, that protective association was present in people not taking a statin, 0.79 (0.70 to 0.89), and absent in those who were: 0.97 (0.77 to 1.22).
The test for whether those two differ didn't settle it, so the null result in treated patients may reflect too few of them, not a true absence of benefit. But the direction of the uncertainty matters. The protective meaning of density has been demonstrated in untreated people, and hasn't been demonstrated in exactly the group who are watching their score climb while on a statin.
So the accurate statement is narrower, and it's still useful: a rising calcium score on treatment is uninterpretable, not alarming. The plaque measurements taken in the same patients show volume falling, dangerous plaque falling, and high-risk features falling. The score rises because its formula multiplies by a quantity the treatment increases. What the rise means for that individual's risk isn't established either way, and the score can't be used to answer the question it was ordered to answer.
There's now outcome evidence about which part of the plaque carries risk, and it doesn't say what it's often reported to say. A registry of 3,551 patients scanned by CT angiography with AI plaque quantification followed them a median of 4.3 years, during which 167 had a cardiovascular event. Twenty-four different plaque measurements were tested. All but two of them predicted events. The headline result, that only narrowing and non-calcified plaque volume remained once the others were accounted for, is a statement about which measurements carry information the others don't already carry. It isn't a finding that the rest are harmless.
Calcified plaque is a case in point, and the registry's analysis by sex separates it out. Taken on its own, alongside age and the usual risk factors, calcified plaque volume predicted events at a hazard ratio of 1.23 per 50 mm³ (95% confidence interval 1.14 to 1.33) in women and 1.05 (1.01 to 1.10) in men. Non-calcified plaque taken on its own predicted at 1.27 and 1.12. Those are comparable. Put both in the same model and the picture separates by sex: in women calcified plaque still carried independent risk at 1.15 (1.06 to 1.26), while in men it fell to 0.98 (0.93 to 1.04) and its information was absorbed by the other measures.
So the fashionable framing, that soft plaque is what matters and calcium doesn't, is an artefact of how these models are built, not a fact about arteries. Calcified plaque marks disease and predicts events. What it doesn't do is tell you whether treatment is working, because treatment increases it. Those are different failures and only the second is a reason to stop watching the calcium score.
Women in that registry had lower values on essentially every plaque measurement than men, and the risk attached to high-risk features was nonetheless greater in them. The same absolute volume doesn't mean the same thing in everyone, which is another reason to read these values as a direction of travel within one person, not as a threshold to compare across people.
The baseline scan and the repeat scan do different jobs
A repeat calcium score is a poor way to find out whether treatment is working, and it's poor for a specific reason, not a vague one: the treatment pushes the score upward through a mechanism unrelated to the benefit. A test whose result is pushed the wrong way by the treatment being tested can't grade that treatment.
This doesn't make the first scan less useful. A baseline calcium score remains one of the better ways to decide whether to treat. It's the repeat scan, ordered to grade the treatment, that doesn't deliver.
The measurement to repeat
A calcium score answers a question once. Someone thinking in decades needs something that can be asked repeatedly and answered the same way each time.
That's a specific kind of measurement, and it has requirements. It has to respond when the treatment works. It has to change more than the test's own variability, so that a change means something. It has to be run the same way each time. And it must not be pushed around by the treatment through some route other than the benefit, which is precisely where the calcium score fails.
Apolipoprotein B
For lipid-lowering treatment, that measurement is apolipoprotein B, or LDL cholesterol where apoB isn't available.
It moves when the treatment works, promptly and proportionately. It's standardised, so a value from one laboratory can be compared with a value from another. What these panels measure, and the order to test in, is in Particle number: counting LDL instead of weighing it. It has a documented relationship to the outcome across 170,000 randomised patients and 312,321 people carrying lifelong genetic variants. And it's cheap enough to repeat without deliberation.
The practical sequence:
- Measure before starting, or before any change in dose. A value taken after the change has begun can't be compared to anything.
- Recheck at six to eight weeks after a dose change, which is when the lipid response has fully expressed. Earlier gives a value still in motion.
- Expect a specific result. A given drug at a given dose produces a reasonably predictable percentage reduction. Writing that expectation down before the result arrives is what converts a lab value into an answer, because a result that lands well short of the expectation is informative, and it isn't informative if no one wrote down what was expected.
- When the result falls short, the question is which of three things happened: the medication isn't being taken as prescribed, it's being taken and isn't working well in this person, or something else is contributing that a statin doesn't address. Those have different next steps, and distinguishing them is the work.
If imaging is going to be repeated anyway
A repeat scan is reasonable when the question is whether disease is present or how extensive it is, not whether a drug is working. If a repeat is done on treatment, the value to look at is not the headline calcium score. Plaque volume, the amount of non-calcified plaque, and the change in high-risk features are the measures that respond in the direction the treatment is working, and CT angiography can report them where a plain calcium scan can't.
The carotid ultrasound report
A carotid intima-media thickness study is the other structural test people arrive with. It's inexpensive and involves no radiation and no contrast, and its progression is the one structural measure tied to event reduction across a large body of trials. It also generates the most confusing reports in this area, so being specific about what they contain matters.
Three national vendors produce most of them, and they report the same study three different ways. All three give a thickness in millimetres for each side. None of them leads with it. One fronts an Arterial Age with alert thresholds for each measurement. One fronts a percentile against a population cohort, plus a Vascular Age. The third fronts a letter grade from A to E across three separate axes, with the millimetres on later pages beside the images.
The derived values are the vendor's opinion, not a measurement. Arterial Age, Vascular Age, the letter grade, and composite scores with names like Plaque Burden or Early Event Risk are calculated by formulas the vendors don't publish, from reference populations that differ between them. One report defines its plaque burden only as the sum of the plaques it found, which is a quantity with no reference range and no units that mean anything outside that vendor's report, and the report prints no normal range for it, because there isn't one. These values aren't comparable between vendors and should not be tracked across a change of vendor.
The part that carries meaning is the plaque. Every one of these reports notes separately whether discrete plaque was seen, where, and what it appeared to be made of, the vocabulary varies (soft, heterogeneous, echogenic, mixed, calcified) but the distinction is the same one that matters in the coronary arteries, and one vendor grades soft plaque as its highest-risk category, above mixed and above calcified. That finding is the durable content of the study.
Two consequences follow.
The first is that a normal thickness doesn't mean no plaque, and the vendors say so on the page. The two findings are separate, and the plaque is the one to read.
One report makes the point better than any argument. A 56-year-old's study returns a mean thickness of 0.63 mm and a maximum of 0.72 mm, both printed in green as normal, above a derived arterial age of 47, nine years younger than the person reading it. The same page then lists the individual segment measurements: 1.8 mm and 2.4 mm on the right side, 1.6 mm and 1.3 mm on the left, three of them marked as containing mineral deposits and one as mixed. That's four discrete plaques, on a study whose headline numbers say better than average. Anyone reading the top of that page and stopping would come away with precisely the wrong impression.
The second is that the millimetre value shouldn't be chased year to year. One vendor states its own reproducibility as within 1.68% using a protocol of 24 to 72 images, which on a typical reading is about 14 micrometres. The change that matters in the trial data is about 10 micrometres per year. The measurement error is larger than the annual signal, and the vendor that publishes a progression threshold sets it at 34 micrometres per year, more than three times the annual effect. So a year-on-year difference is noise, a three-year difference at the same laboratory with the same protocol might not be, and switching vendors makes the comparison meaningless.
The structural question that has no validated answer
Someone treating a forty-year horizon eventually asks the harder version of this: how do I know when I have done enough? Blood markers answer whether a drug is working. They don't answer whether the disease has stopped advancing.
The measurement that would answer it's a repeat scan reading plaque composition, because that's the only thing that looks at the disease, not at a risk factor for it. Whether repeating it improves outcomes hasn't been tested. The trial would have to randomise people to imaging-guided versus blood-marker-guided treatment and follow them for decades, and it isn't going to be run, the cost and the duration rule it out, and no one has a commercial reason to fund it. So the absence of evidence here is a fact about what trials get paid for, not a finding about the strategy.
What can be said is narrower and still useful. The two candidate approaches fail in different ways, and the choice is between their failure modes, not between validated and unvalidated.
A repeat carotid ultrasound costs little and carries no radiation, and its millimetre change is buried in its own measurement error. Its value is the plaque finding, not the trend.
A repeat coronary angiogram by CT reads the compartment that moves, the soft plaque falls while the calcium hardens, and it answers the question the calcium score can't. Its constraint is radiation dose, which bounds how often it can reasonably be done, and it doesn't rule it out. Which of these tests to order, and when, is covered in Cleerly, CCTA, and calcium scores: which heart test, when?.
Neither has been shown to improve outcomes. One is limited by noise, the other by radiation dose (which may improve with technological progress). That's the actual state of things, and a patient deciding how to spend the next forty years is better served by knowing which limitation they're accepting than by being told either that the scan is proven or that it's pointless.
Deciding what to add, and when to stop
apoB is a short-term readout. Measured before a change and again six to eight weeks later, it confirms that the last thing you did worked on the blood. That's useful and it's a small question. It says nothing about which lever to reach for next, how hard to push, or whether you've done enough, and those are the questions that actually occupy four decades, particularly now that the list of levers is long and getting longer: statins, ezetimibe, PCSK9 inhibitors, inclisiran, bempedoic acid, drugs for lipoprotein(a) that are close, the GLP-1 agonists, blood pressure, and training.
No measurement settles the sequence. But three things narrow it, and they're the closest thing to an answer this evidence supports.
Duration outranks intensity. This is the one part that's quantitative. A given reduction in apoB or LDL held across a lifetime is associated with roughly three times the risk reduction of the same reduction started in middle age and held for five years. So the highest-yield decision isn't which agent to add but how early the level comes down and how long it stays down. A moderate regimen taken for thirty years beats an optimal one abandoned after three, and that ordering isn't close.
Rank each lever by what it removes that nothing else can. apoB-carrying particles come first because they're the largest modifiable burden and several drugs address them. Lipoprotein(a) matters not because it's bigger but because nothing currently removes it, which is why the drugs in trials for it are ones to track. Current and emerging options are in Lp(a) therapies, now and soon. Blood pressure, glucose and fitness act on the same arteries by different routes and aren't substitutes for the lipid work. The question to ask of any addition is what it takes off the table that the existing regimen doesn't.
The stopping point is set by what can be sustained, not by a target. No floor has been found: the relationship between achieved level and benefit stayed straight down to the lowest values anyone has studied, and the large trials found no threshold below which further lowering stopped helping. So escalation doesn't end when a threshold is reached. It ends where side effects, cost, or the sheer burden of the regimen start to threaten the one thing that matters most, which is still taking it in twenty years.
That leaves imaging with a job, and it isn't titration. Scans are too slow, too coarse and too radiation-limited to tune a dose. What a scan every few years can do is check whether the disease is behaving the way the blood values predict for this particular person. Most of the time it will be, and the plan continues. Occasionally it won't, the patient whose plaque advances despite a level that should have stopped it, and that's the finding that changes the priorities, not the dose. That patient exists: even at an LDL of 37 mg/dL, a third of people in the PCSK9 trial were still progressing, and nobody has identified what was driving it.
Which is the answer, such as it is. Follow the blood to know the drug is working. Reach for the lever that removes something the others can't. Start earlier instead of pushing harder. And use imaging not to grade the treatment but to find out whether you're the exception.
References
Plaque regression trials
- Nissen SE, Nicholls SJ, Sipahi I, et al. Effect of very high-intensity statin therapy on regression of coronary atherosclerosis: the ASTEROID trial. JAMA 2006;295(13):1556–1565. https://doi.org/10.1001/jama.295.13.jpc60002
- Nissen SE, Tuzcu EM, Schoenhagen P, et al. Effect of intensive compared with moderate lipid-lowering therapy on progression of coronary atherosclerosis: the REVERSAL trial. JAMA 2004;291(9):1071–1080. https://doi.org/10.1001/jama.291.9.1071
- Nicholls SJ, Ballantyne CM, Barter PJ, et al. Effect of two intensive statin regimens on progression of coronary disease (SATURN). N Engl J Med 2011;365:2078–2087. https://doi.org/10.1056/NEJMoa1110874
- Nicholls SJ, Puri R, Anderson T, et al. Effect of evolocumab on progression of coronary disease in statin-treated patients: the GLAGOV randomized clinical trial. JAMA 2016;316(22):2373–2384. https://doi.org/10.1001/jama.2016.16951
- Dawson LP, Lum M, Nerleker N, Nicholls SJ, Layland J. Coronary atherosclerotic plaque regression: JACC state-of-the-art review. J Am Coll Cardiol 2022;79(1):66–82. https://doi.org/10.1016/j.jacc.2021.10.035, source for the absence of direct outcome evidence linking plaque regression to events, and (reviewed in) for outward arterial remodelling up to roughly 40% plaque area.
How low, and over what horizon
- Cholesterol Treatment Trialists' Collaboration. Efficacy and safety of more intensive lowering of LDL cholesterol: a meta-analysis of data from 170,000 participants in 26 randomised trials. Lancet 2010;376(9753):1670–1681. https://doi.org/10.1016/S0140-6736(10)61350-5
- Ference BA, Yoo W, Alesh I, et al. Effect of long-term exposure to lower low-density lipoprotein cholesterol beginning early in life on the risk of coronary heart disease: a Mendelian randomization analysis. J Am Coll Cardiol 2012;60(25):2631–2639. https://doi.org/10.1016/j.jacc.2012.09.017
- Khera AV, Cuchel M, de la Llera-Moya M, et al. Cholesterol efflux capacity, high-density lipoprotein function, and atherosclerosis. N Engl J Med 2011;364(2):127–135. https://doi.org/10.1056/NEJMoa1001689
- Jin Z, Collier TS, Dai DLY, et al. Development and validation of apolipoprotein AI-associated lipoprotein proteome panel for the prediction of cholesterol efflux capacity and coronary artery disease. Clin Chem 2019;65(2):282–290. https://doi.org/10.1373/clinchem.2018.291922
- Rohatgi A, Khera A, Berry JD, et al. HDL cholesterol efflux capacity and incident cardiovascular events. N Engl J Med 2014;371(25):2383–2393. https://doi.org/10.1056/NEJMoa1409065
- Saleheen D, Scott R, Javad S, et al. Association of HDL cholesterol efflux capacity with incident coronary heart disease events: a prospective case-control study. Lancet Diabetes Endocrinol 2015;3(7):507–513. https://doi.org/10.1016/S2213-8587(15)00126-6
- Gibson CM, Duffy D, Korjian S, et al. Apolipoprotein A1 infusions and cardiovascular outcomes after acute myocardial infarction (AEGIS-II). N Engl J Med 2024;390(17):1560–1571. https://doi.org/10.1056/NEJMoa2400969
Calcium and plaque composition
- Puri R, Nicholls SJ, Shao M, et al. Impact of statins on serial coronary calcification during atheroma progression and regression. J Am Coll Cardiol 2015;65(13):1273–1282. https://doi.org/10.1016/j.jacc.2015.01.036
- Criqui MH, Denenberg JO, Ix JH, et al. Calcium density of coronary artery plaque and risk of incident cardiovascular events. JAMA 2014;311(3):271–278. https://doi.org/10.1001/jama.2013.282535
- Nekouei Shahraki M, Mohammadi Jouabadi S, Bos D, Stricker BH, Ahmadizar F. Statin use and coronary artery calcification: a systematic review and meta-analysis of observational studies and randomized controlled trials. Curr Atheroscler Rep 2023;25:769–784. https://doi.org/10.1007/s11883-023-01151-w
- van Rosendael AR, van den Hoogen IJ, Gianni U, et al. Association of statin treatment with progression of coronary atherosclerotic plaque composition. JAMA Cardiol 2021;6(11):1257–1266. https://doi.org/10.1001/jamacardio.2021.3055
- Lee S-E, Chang H-J, Sung JM, et al. Effects of statins on coronary atherosclerotic plaques: the PARADIGM study. JACC Cardiovasc Imaging 2018;11(10):1475–1484. https://doi.org/10.1016/j.jcmg.2018.04.015
- Giovannucci J, Shanbhag A, Hong W, et al. Impact of statins on progression of coronary artery calcium composition and density as assessed by noncontrast CT. Int J Cardiovasc Imaging 2025;41(12):2481–2492. https://doi.org/10.1007/s10554-025-03561-0
- Yong Y, Giovannucci J, Pang SN, et al. Coronary artery calcium density and risk of cardiovascular events: a systematic review and meta-analysis. JACC Cardiovasc Imaging 2025;18(3):294–304. https://doi.org/10.1016/j.jcmg.2024.07.024
Outcomes with AI plaque quantification
- van Rosendael AR, Nakanishi R, Bax JJ, et al. AI-driven quantitative coronary CT angiography in suspected coronary artery disease: the multicenter CONFIRM2 registry. JACC Adv 2026;5(3):102618. https://doi.org/10.1016/j.jacadv.2026.102618
- Feuchtner GM, Lacaita PG, Pontone G, et al. AI-quantitative CT coronary plaque features associate with a higher relative risk in women: the CONFIRM2 registry. Circ Cardiovasc Imaging 2025;18. https://doi.org/10.1161/CIRCIMAGING.125.018235
Carotid intima-media thickness
- Willeit P, Tschiderer L, Sweeting MJ, et al., for the PROG-IMT and Proof-ATHERO Study Groups. Carotid intima-media thickness progression as surrogate marker for cardiovascular risk: meta-analysis of 119 clinical trials involving 100 667 patients. Circulation 2020;142:621–642. https://doi.org/10.1161/CIRCULATIONAHA.120.046361
Want your calcium score or CT angiogram read by a cardiologist?
Book a Video Visit