

Particle number: counting LDL instead of weighing it
A Cardio IQ or NMR LipoProfile report arrives with numbers your regular cholesterol panel has never mentioned. LDL particle number, in the low thousands. Small LDL, medium LDL, large HDL. A peak size in Ångströms, to one decimal place. A letter, A or B, that sounds like a grade.
Your LDL cholesterol may be perfectly good and several of these may be flagged anyway. The panel is measuring something the standard test cannot see, and the question is what that something is worth.
Patients bring these panels to visits most weeks, usually ordered somewhere else and handed over with reference ranges and no interpretation. Reading them is ordinary work in a preventive cardiology practice, and the answer turns out to be more interesting than either the marketing or the dismissal.
Counting particles instead of weighing cholesterol
Your standard LDL cholesterol result is a weight, not a count. It measures how much cholesterol is being carried inside your LDL particles, in milligrams per deciliter of blood.
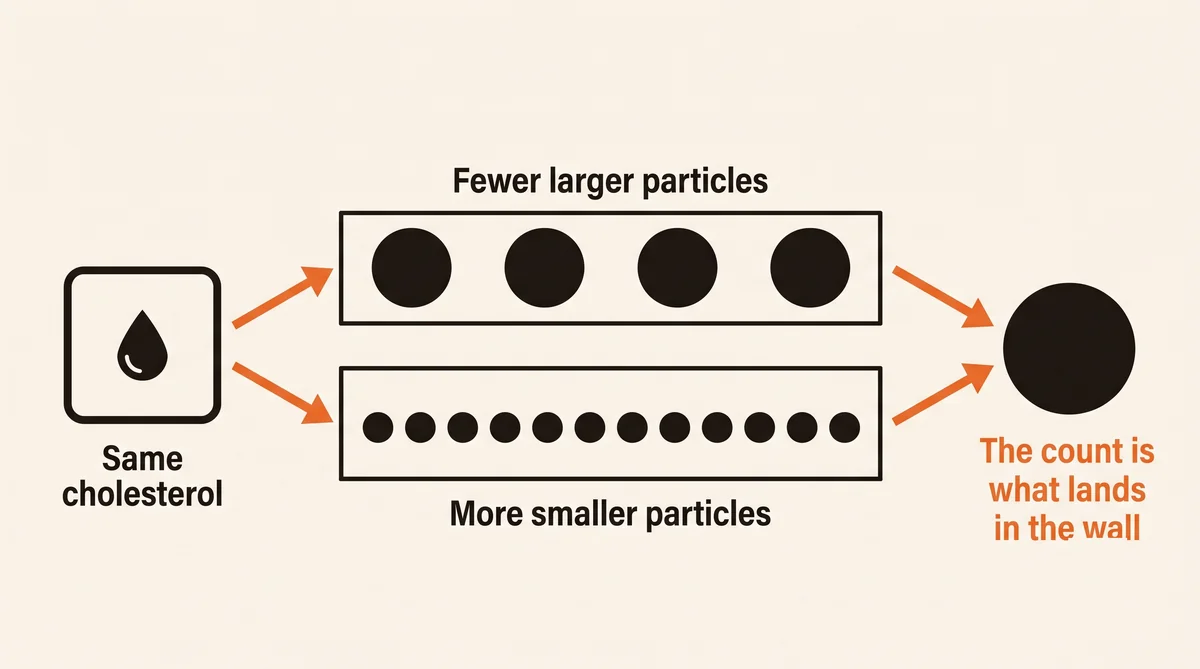
The number of particles carrying that cholesterol is not fixed. Each LDL particle can be loaded up with cholesterol or running relatively empty, and how loaded they are varies from person to person. Two people can carry identical LDL cholesterol with quite different particle counts: one with fewer, fatter particles, one with more, leaner ones.
This matters because of how atherosclerosis starts. A particle has to cross the artery wall and lodge there, and each particle that does so is one event, whatever it happens to be carrying. If the count and the weight disagree, the mechanistic argument says risk should follow the count.
That is the premise. What follows is what happened when it was tested.
Reading your panel
Quest's Cardio IQ panel runs on ion mobility, which sorts particles by how they move through a gas. LabCorp's NMR LipoProfile uses nuclear magnetic resonance. Boston Heart and others use gradient gel electrophoresis or ultracentrifugation. All four count and size particles; none of them does it the same way.
Quest's reference bands read:
| Optimal | Intermediate | High | |
|---|---|---|---|
| LDL particle number | below 1138 | 1138 to 1409 | above 1409 nmol/L |
| LDL small | below 142 | 142 to 219 | above 219 nmol/L |
| LDL medium | below 215 | 215 to 301 | above 301 nmol/L |
| HDL large | above 6729 | 6729 to 5353 | below 5353 nmol/L |
| LDL peak size | above 222.9 | 222.9 to 217.4 | below 217.4 Å |
| LDL pattern | A | B |
Two features of that table deserve attention before any of the numbers do.
The pattern row has no middle. Peak size is a continuous measurement, reported to a tenth of an Ångström, and then collapsed into two named categories. The entire boundary between pattern A and pattern B spans 217.4 to 222.9 Å, a range of about 2.5 percent of the value. A shift too small to mean anything biologically can move you from one labelled phenotype to the other.
Nothing here converts to anything else. Quest reports size in Ångströms; LabCorp reports it in nanometers. Quest reports subclass concentrations in nmol/L; LabCorp reports small LDL as a particle count. Each vendor sets its own cut points. Comparing this year's result against a different lab's result from last year is not possible, and this is the practical problem the rest of the panel's decimal places obscure.
The evidence that particle count carries information
Framingham Offspring (Cromwell and colleagues, J Clin Lipidol 2007) measured LDL particle number by NMR in 3,066 middle-aged participants without cardiovascular disease, then followed them a median of 14.8 years, recording 531 first cardiovascular events. Particle number related more strongly to future events than either LDL cholesterol or non-HDL cholesterol, in both sexes.
The useful comparison is at the bottom of each range. Among people in the lowest quartile, event rates per 1,000 person-years were:
| Measure in its lowest quartile | Events per 1,000 person-years |
|---|---|
| LDL particle number | 59 |
| Non-HDL cholesterol | 74 |
| LDL cholesterol | 81 |
A low particle count identified low risk better than a low cholesterol did. The same study also produced the number that gets quoted loosely: among 764 people in the bottom quartile of LDL cholesterol, 161 of them, or 21 percent, had a particle number that was not correspondingly low. Their event rate was 85 per 1,000 person-years against 65 in the group whose two numbers agreed.
That 21 percent is worth stating precisely, because it is often repeated as though a third of everyone has discordant results. It is the fraction of people already at low LDL cholesterol whose particle count fails to match.
JUPITER (Mora and colleagues, Circulation 2015) tested the same idea inside a randomized trial. Among 11,186 participants, ion mobility particle concentrations were measured at baseline and after allocation to rosuvastatin or placebo, with 307 first cardiovascular events. In the placebo group, hazard ratios per standard deviation were:
| Measure | Hazard ratio (95% CI) |
|---|---|
| LDL cholesterol | 1.03 (0.88 to 1.21) |
| Non-HDL cholesterol | 1.18 (1.01 to 1.38) |
| Apolipoprotein B | 1.28 (1.11 to 1.48) |
| Ion mobility LDL particles | 1.21 (1.07 to 1.37) |
| Ion mobility HDL subfractions | not associated |
LDL cholesterol predicted nothing here. Particle measures did. But JUPITER enrolled only people whose LDL cholesterol was already below 130 mg/dL, so that measure had a deliberately narrow range, which is the ordinary explanation for a flat result. The finding is about this population, not about LDL cholesterol in general.
Coronary angiography provides the strongest version of the argument (Williams and colleagues, Atherosclerosis 2014). In 136 patients with baseline and follow-up angiograms, all four measurement technologies were run on the same samples. All four independently associated small dense LDL with three-year progression of stenosis: gradient gel electrophoresis at P=10⁻⁶, ion mobility at P=0.0007, NMR at P=0.001, ultracentrifugation at P=0.002.
Four different machines, one set of patients, the same answer, against pictures of the arteries rather than a risk score. Three of the four survived adjustment for apolipoprotein B.
The evidence that it adds little
The Women's Health Study (Mora and colleagues, Circulation 2009) followed 27,673 initially healthy women for 11 years, recording 1,015 events, with lipoproteins measured by NMR at baseline. Comparing top to bottom quintile:
| Measure | Hazard ratio (95% CI) |
|---|---|
| Total cholesterol to HDL ratio | 2.82 (2.23 to 3.58) |
| Apolipoprotein B to A-1 ratio | 2.79 (2.21 to 3.54) |
| Triglycerides | 2.58 (1.95 to 3.41) |
| Apolipoprotein B | 2.57 (1.98 to 3.33) |
| LDL particle number | 2.51 (1.91 to 3.30) |
| LDL cholesterol | 1.74 (1.40 to 2.16) |
| HDL particle number | 0.91 (0.75 to 1.12) |
Particle number performed well, and slightly worse than the total-to-HDL cholesterol ratio, which is calculated free from tests you have already had. Adding particle number to a model that already contained that ratio and the usual risk factors improved classification by zero percent. Adding apolipoprotein B improved it by 1.9 percent. Neither improved the model's discrimination significantly.
A meta-analysis of 233,455 people and 22,950 events (Sniderman and colleagues, Circ Cardiovasc Qual Outcomes 2011) ranked the markers directly: apolipoprotein B at 1.43 (1.35 to 1.51), non-HDL cholesterol at 1.34 (1.24 to 1.44), LDL cholesterol at 1.25 (1.18 to 1.33). Over ten years, treating everyone above the 70th percentile, the authors estimated an apolipoprotein B strategy would prevent 500,000 more events than a non-HDL cholesterol strategy.
Apolipoprotein B counts particles too. It counts every atherogenic particle, one molecule each, by a standardized and inexpensive immunoassay available at any laboratory. It is not a fractionation panel, and in this analysis it beat everything.
Two large studies reached the same practical conclusion by different routes. Framingham investigators found that the apolipoprotein ratio "did not offer incremental utility over total cholesterol:HDL-C." The Emerging Risk Factors Collaboration, pooling individual data on 302,430 people, concluded that lipid assessment "can be simplified by measurement of either total and HDL cholesterol levels or apolipoproteins."
The 2026 dyslipidemia guideline reflects this. It rates routine advanced lipoprotein testing to estimate risk and guide the start of therapy as Class 3, No Benefit, citing lack of standardization across assays, information overload, and uncertainty about who benefits.
Much of the discordance was an artifact of the arithmetic
Framingham estimated LDL cholesterol with the Friedewald formula: total cholesterol, minus HDL, minus triglycerides divided by five. That last term assumes a fixed ratio of triglyceride to cholesterol in the particles Friedewald is subtracting out, and the assumption fails as triglycerides rise.
Which is to say it fails in exactly the people the particle panel is sold to. High triglycerides, insulin resistance, metabolic syndrome: the phenotype where LDL cholesterol appears reassuring and particle number does not is also the phenotype where Friedewald systematically underestimates LDL cholesterol.
So the discordance is partly biology and partly a subtraction error, and the two have been reported together for twenty years.
Better equations exist and are now in use. The Martin/Hopkins method replaces the fixed divisor with one that adjusts to the sample, and the 2026 guideline states that it "markedly reduces discordance with apoB compared with the Friedewald equation." Among people whose LDL cholesterol is below 70 mg/dL by Martin/Hopkins, roughly 2 percent have non-HDL cholesterol above target and about 1 percent have apolipoprotein B above target.
Against the 21 percent from Framingham, that is most of the gap closing without anyone measuring a particle.
Non-HDL cholesterol avoids the problem entirely, because it involves no estimate at all. Total cholesterol minus HDL cholesterol, one subtraction, no assumed ratios. It appears on every lipid panel already run, costs nothing additional, and in Framingham it tracked LDL cholesterol at r=0.94 while carrying more of the information that particle counts carry.
The reclassification argument has a date on it
That zero percent figure is the strongest-sounding evidence against these panels, and it carries a hidden condition.
Reclassification is not a property of a blood test. It measures whether a marker moves people across decision boundaries, which means it depends entirely on where the boundaries are and what you can do once someone crosses one.
In 2009, in a population of healthy women, the decision was close to binary: statin, or no statin. Ezetimibe had no outcome trial until 2015. PCSK9 inhibitors did not exist clinically until 2017. Inclisiran, bempedoic acid and icosapent ethyl did not exist. LDL cholesterol targets sat well above where they sit now.
The current guideline names targets of below 70 and below 55 mg/dL depending on risk, and the direction of travel is downward; below 40 is coming. The drug shelf has six options where it had one. And coronary CT angiography can now show soft plaque directly, which both competes with blood markers and creates new work for them, such as deciding who should be imaged in the first place.
None of that makes the 2009 analysis wrong. It was rigorous and its result stands for what it measured. But the question it answered, whether particle number moves a healthy woman across the line into taking a statin, is not the question a patient asks in 2026. That question is: I am on a statin, my LDL cholesterol is at goal, is there risk left, and should I add something.
Nobody has run the reclassification analysis against that decision. The fair verdict on these panels is not that they add nothing. It is that they have not been tested against the decision that now matters.
No trial has randomized anyone to a treatment strategy based on their subfraction results and counted events. Prediction is not the same as usefulness, and neither has been shown.
Small dense LDL travels with insulin resistance
Pattern B rarely arrives alone. In 682 female twins (Selby and colleagues, Circulation 1993), the prevalence of pattern B or the intermediate pattern rose from 5.6 percent in women with no features of the insulin resistance syndrome to 100 percent in women with four. After adjustment for age and body mass index, the pattern was independently associated with higher triglycerides, higher waist-to-hip ratio, higher fasting and post-load insulin, higher systolic blood pressure, and lower HDL cholesterol.
Then the part that settles it. Among 25 pairs of identical twins who differed in subclass pattern, sharing a genome and differing in phenotype, the twin with pattern B had higher body mass index, higher waist-to-hip ratio, and higher systolic blood pressure than her sister. The authors concluded that "nongenetic, that is, behavioral or environmental factors are important for the expression of the phenotype."
Pattern B is not a fixed inheritance. It is largely a readout of metabolic state, and it moves when that state moves.
This also explains a puzzle in the angiographic study. Small dense LDL survived adjustment for triglycerides, HDL cholesterol, LDL cholesterol and apolipoprotein B. But small LDL correlates with total particle number at r=0.76, and in a separate dataset the association disappeared once total particle number was accounted for. So small dense LDL carries information beyond a standard panel, and most of what it carries may be particle count rather than particle size.
For a patient the distinction matters less than it looks, because both point the same way.
How this gets worked through in a visit
The order matters more than the individual choices, because each step is cheaper than the one after it and often removes the need for it. This is the sequence we run.
Check which equation the laboratory used. If LDL cholesterol was calculated by Friedewald and triglycerides run above about 150 mg/dL, the number is probably an underestimate, and a good part of any apparent discordance is arithmetic rather than biology. Martin/Hopkins and the Sampson/NIH equation are both better and are what the current guideline prefers. Most patients have never been told which one produced their number, and it is on the report or obtainable from the lab.
Read the non-HDL cholesterol. Total cholesterol minus HDL cholesterol. It is already on the panel you paid for, it requires no equation, and it captures the cholesterol in every atherogenic particle rather than LDL's alone. If it is at goal, the case that something is hiding is already weak.
Measure apolipoprotein B. One molecule per atherogenic particle, measured directly, on a standardized assay at any laboratory, for a few dollars. Across 233,455 people it outperformed every cholesterol measure, and in the trial built around ion mobility it matched the fractionation panel. This is a routine order here and the one worth having if a patient wants a particle count.
A full subfraction panel comes fourth, and it is optional. It measures the same phenotype at higher resolution. No study has shown that acting on the extra resolution changes outcomes, and adding particle number to a model containing the free cholesterol ratio improved classification by nothing. If a patient has already paid for one, it gets read; it is rarely the thing worth paying for next.
Pattern B is read as metabolic information. It tracks insulin resistance closely enough that in one twin study its prevalence went from 5.6 percent to 100 percent across four features of that syndrome. What moves it is weight, activity, alcohol and refined carbohydrate, which is also what the vendors' own reports advise. It is not primarily a message about which lipid drug is needed, and treating it as one leads people toward prescriptions they may not need and away from the changes that would actually move the number.
Stay with one laboratory. The methods do not convert. Ångströms and nanometers, nmol/L and particle counts, vendor-specific cut points: changing labs makes your own history unreadable. Worth deciding once, early.
The finding that changes management is a particle count or apolipoprotein B that stays high after the arithmetic has been corrected and non-HDL cholesterol is at goal. That is the residual this panel exists to catch. It carried a measurably higher event rate in Framingham, and it is the point at which the conversation turns to adding a second agent, or to looking at the arteries directly with a CT angiogram rather than inferring from particle size.
What has never been tested is whether treating by subfraction beats treating by apolipoprotein B. Until somebody runs that trial, the extra resolution is information rather than instruction, and it should be priced accordingly.
Bring whatever you already have, whoever ordered it. Most of the work is deciding which numbers should change what you take, and which are interesting and not yet actionable.
References
The two sides of this question were argued in print, in the same journal and the same issue, and both pieces remain the clearest statements of each position:
- Superko HR. Advanced lipoprotein testing and subfractionation are clinically useful. Circulation 2009;119:2383–2395.
- Mora S. Advanced lipoprotein testing and subfractionation are not (yet) ready for routine clinical use. Circulation 2009;119:2396–2404.
Studies cited above, in order of appearance:
- Cromwell WC, Otvos JD, Keyes MJ, et al. LDL particle number and risk of future cardiovascular disease in the Framingham Offspring Study. J Clin Lipidol 2007;1:583–592.
- Mora S, Caulfield MP, Wohlgemuth J, et al. Atherogenic lipoprotein subfractions determined by ion mobility and first cardiovascular events after random allocation to high-intensity statin or placebo: the JUPITER trial. Circulation 2015;132:2220–2229.
- Williams PT, Zhao X-Q, Marcovina SM, et al. Comparison of four methods of analysis of lipoprotein particle subfractions for their association with angiographic progression of coronary artery disease. Atherosclerosis 2014;233:713–720.
- Mora S, Otvos JD, Rifai N, et al. Lipoprotein particle profiles by nuclear magnetic resonance compared with standard lipids and apolipoproteins in predicting incident cardiovascular disease in women. Circulation 2009;119:931–939.
- Sniderman AD, Williams K, Contois JH, et al. A meta-analysis of low-density lipoprotein cholesterol, non-high-density lipoprotein cholesterol, and apolipoprotein B as markers of cardiovascular risk. Circ Cardiovasc Qual Outcomes 2011;4:337–345.
- Ingelsson E, Schaefer EJ, Contois JH, et al. Clinical utility of different lipid measures for prediction of coronary heart disease in men and women. JAMA 2007;298:776–785.
- Di Angelantonio E, Sarwar N, Perry P, et al. (Emerging Risk Factors Collaboration). Major lipids, apolipoproteins, and risk of vascular disease. JAMA 2009;302:1993–2000.
- Martin SS, Blaha MJ, Elshazly MB, et al. Comparison of a novel method vs the Friedewald equation for estimating low-density lipoprotein cholesterol levels from the standard lipid profile. JAMA 2013;310:2061–2068.
- Selby JV, Austin MA, Newman B, et al. LDL subclass phenotypes and the insulin resistance syndrome in women. Circulation 1993;88:381–387.
- Robinson JG. What is the role of advanced lipoprotein analysis in practice? J Am Coll Cardiol 2012;60:2607–2615.
- Blumenthal RS, et al. 2026 ACC/AHA/AACVPR/ABC/ACPM/ADA/AGS/APhA/ASPC/NLA/PCNA Guideline on the Management of Dyslipidemia. J Am Coll Cardiol 2026; in press.
Want your particle number and lipid panel read by a cardiologist?
Book a Video Visit